Automating Funnel Analysis with the MixPanel API

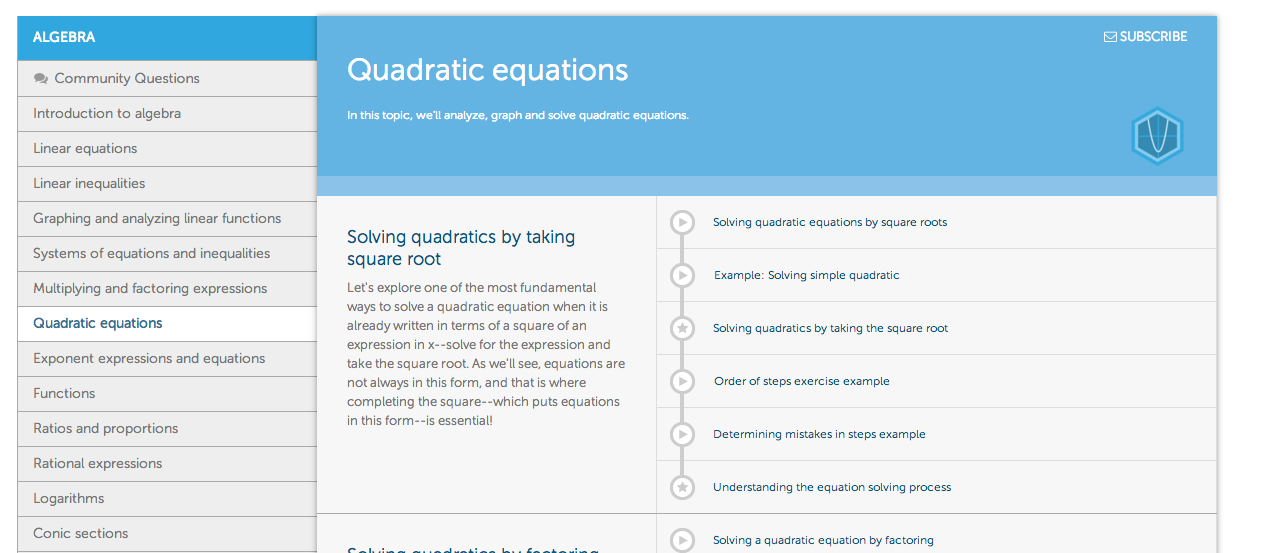
The content on Khan Academy is organized into a large taxonomy that breaks down by Domain, Subject, Topic, and Tutorial.  For example, information about quadratic equations is located in the Math domain, Algebra subject, Quadratic equations topic, and the first tutorial is titled Solving quadratics by taking square root.

khan academy tutorial view

Our content creators have organized these tutorials in what their pedagogical understanding tells them is the most conducive to learning, but we wanted to understand how many students were actually working all the way through them.  MixPanel funnel analysis seemed like the perfect tool to get at this information, but creating each funnel by clicking through the web UI was out of the question.  I wanted to build funnels for all ~1,000 tutorials on the site.  I dug through the MixPanel API documentation, but found nothing about funnel analysis.  I sent an email to MixPanel support who replied with some very useful information about an undocumented API called arb_funnels.  This API allows you to programmatically construct and download data for a funnel of events, but does not save this funnel into the list of existing funnels in the web UI.  Perfect!

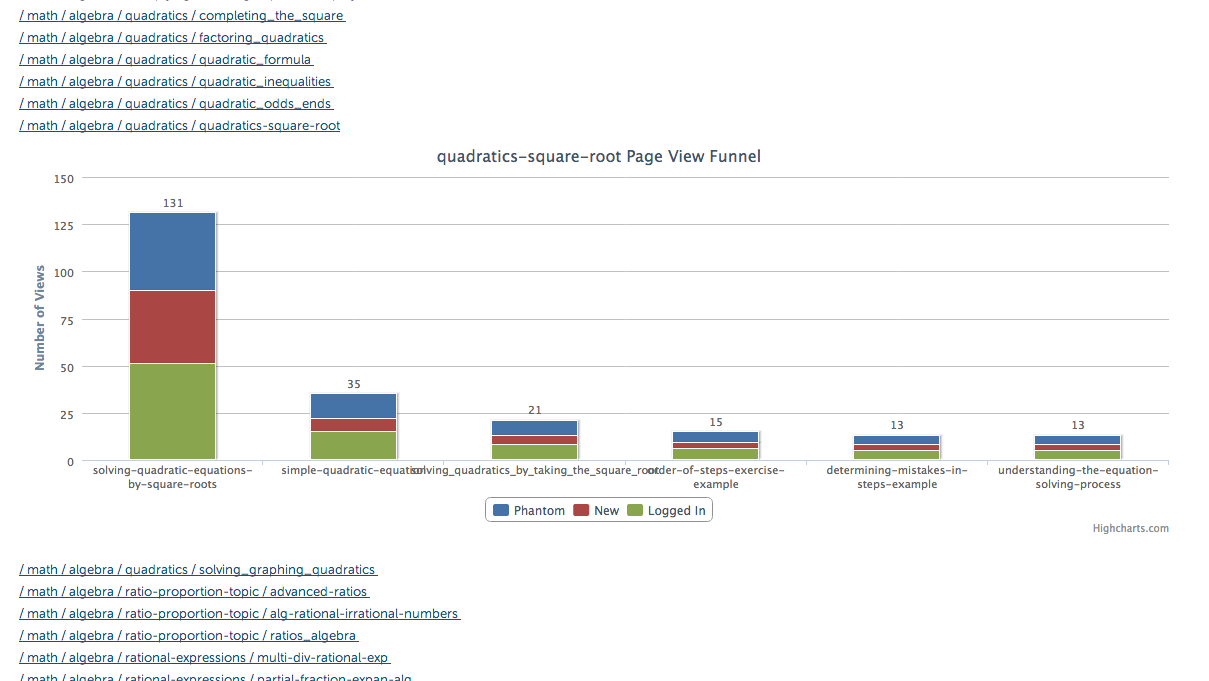
Using the MixPanel python client for data export, the database that describes the full taxonomy of content, and some highcharts.js, I was able to build this page that allows content creators to see their tutorials’ engagement funnels with a single click.  When you click on one of the links, the page pulls data from the MixPanel API and displays the funnel graph for that tutorial.  The graph shows the number of users who viewed the first page of the tutorial, and then the second page, and then the third page, and so on.  Each bar is further broken down by how many views came from unregistered users (what we call phantoms), new users (registered in the past month), and logged in users.  Note that MixPanel allows some fuzziness in these calculations.

automatically created mixpanel funnel page

Armed with this tool, our content creators are able to see how users flow through the sequence of their content and notice any weak spots.  For example, the bitcoin tutorial funnel attracts a lot of new users, but it has a particularly bad drop-off rate after the first two videos.  A curve like this tells us that we need to make the introduction to the material more approachable for a broader audience, and maybe even split this into two tutorials: one as an overview, and another as an extension that goes into the details.

bitcoin tutorial funnel

The process I described here is a manual back-and-forth where the tutorial curator looks at the data and makes tweaks over time (graphs are built on a per-month basis).  In the future, I plan to automate content sequencing experiments within the queue of content that we recommend to users in their learning dashboard. Duolingo does this with their language-learning content in what they call tree experiments.

If you want to try creating your own funnels, here’s how I extended the MixPanel class to add a get_page_view_funnel() function.  The data export API has a lot of standard parameters, so it shouldn’t be too hard to extend this technique to perform more complex funneling and bucketing analysis.  Let me know if you wind up using this technique to build any cool dashboards!

Machine Learning Learning: Coursera Reviews

Since moving to the analytics team at Khan Academy, I have endeavored to grow my knowledge and skills in machine learning and data analysis, to help balance my data science venn.  Thankfully, there are quite a few free online courses available at Coursera that cover these topics in great detail.  Over the second half of 2013, I completed several of these courses and wanted to write a quick review of each of them.

Machine Learning, by Andrew Ng

Hours/week: 15

This course is great not only for its content, but also as an experience in the evolution of online education itself.  This was the first successful MOOC put out by Stanford and became the basis of Andrew Ng and Daphne Koller founding Coursera.  Each week the lecture introduces the mathematics behind each concept, goes through some visualizations to build an intuition for how they work, and then leads into how to put these tools together to make useful predictions.  The course uses Octave, a free alternative to MatLab, for all of the programming assignments.  You upload your completed programming assignment into the website and it immediately responds with how your code performed against the test cases.  This immediate feedback loop was very beneficial in working through the homework assignments and debugging until everything was perfect. The course does a great job of exposing and building intuition for most of the fundamental concepts for machine learning, but since the programming assignments are very well contained, it is light on end-to-end model building skills.

Data Analysis, by Jeffrey Leek

Hours/week: 8 + 20 hours for 2 peer-graded papers

This was a great course!  The lectures were full of worked examples in the R programming language, which were very helpful in portraying the key concepts while also explaining some of the tips and tricks required to get things working. The weekly quizzes were cleverly composed to ask correlated questions that required critical thinking on top of the material described in the lectures.

The analysis assignments were structured to take you through an entire workflow of visualizing and exploring data to find interesting patterns, boiling down the most important factors into a statistical model, and then communicating the entire process to interested parties.  The final result was a whitepaper style report which was submitted to the website for peer grading.  After the submission deadline, you were required to evaluate your own paper and four of your peers using a system of ~15 Likert scales.  Your final grade was a combination of the self and peer evaluations you received. The open-ended nature of the project had me obsessively sleuthing through the datasets, while the great communication on the forums helped to pull me out of some rabbit holes when I went too deep.  I spent more time on these forums than I have for any other course, and it was all time very well spent.

Big Data in Education, by Ryan Baker

Hours/week: 2

Although the content of this course does a good job of exploring the landscape of recent research in educational data mining, the style and depth leaves a lot to be desired.  The first few weeks gave me a reason to download and try out RapidMiner, but the assignments after that were algebraic plug’n’play equations from the lecture notes.  The lectures themselves were the professor reading directly from his PowerPoint slides. I found myself watching the lectures at 2x speed and then following up by skimming through the research papers that were referenced. I am glad I went through the course and think it will inspire new ideas and provide good research references, but cannot recommend it beyond that.

Next steps

In the next few months, I plan to complete Computing for Data Analysis to continue honing my R skills, and Model Thinking to learn more about existing models that have proved useful. Courses high on my watch list are Probabilistic Graph Models and Social Network Analysis.

I’ll keep you updated as I make my way through these courses. Let me know in the comments if you have encountered any other particularly insightful learning resources!